
We’ve now entered the tail end of the mathabet, where the list of ideas beginning with a certain letter not only gets thin, but where many of them are related to each other in such a way that it’s easier to think about them together instead of in separate posts. So, here in this post, I’m doing something a bit different than I have so far. Today, we are combining mathematical ideas that begin with X and Y into one post.
Ready to get started?
{This is a modified transcript for Episode 52 of the I See Math People podcast. To listen instead, click here.}
Let’s first just take a moment to acknowledge you may have a bit of math class trauma around X and Y. They are the most common letters that show up in your math problems. Remember, though, these letters serve to represent unknown values we are solving for or values that can vary depending on the situation. That’s why they are called variables. Also remember you can use any symbol you want and it will all turn out the same. So, if letters bother you, use a star or a square or even a smiley face to represent the variables. Just make sure to use a different symbol for each unknown.
Okay. So now that is out of the way, let’s talk about the X and Y axis and the X and Y intercepts.
X-Axis & Y-Axis
You probably just relived a bit of that math class trauma when you read those terms and are frantically denying you ever encounter these ideas now that you are not in math class anymore.
Take a breath. It’s all good. I promise.
Picture the graph on your electricity usage statement. The one that shows your monthly usage for the past year and how your home compares to other in your area. Here’s mine as a bar graph, but yours could also be a line graph.
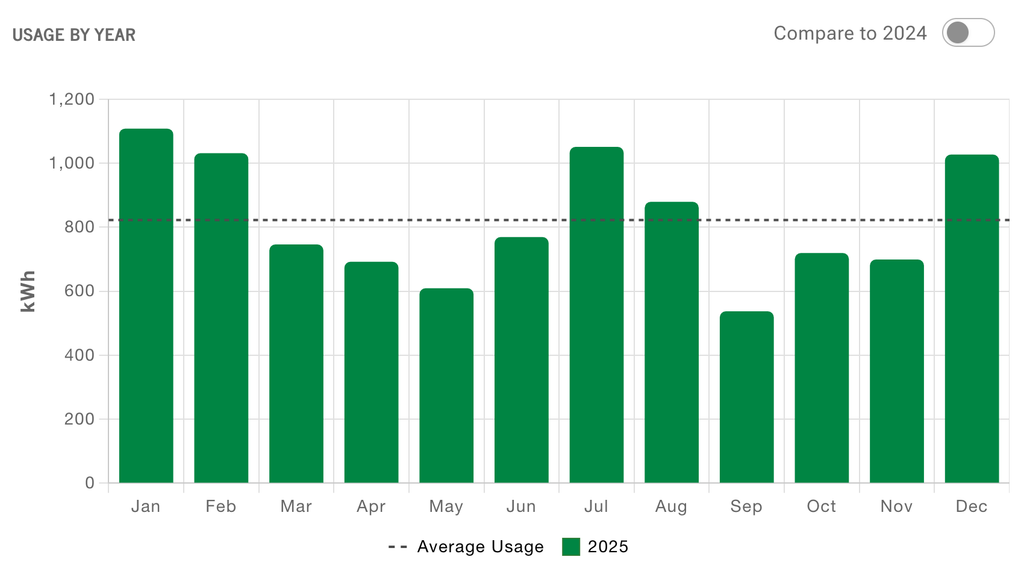
The horizontal line that runs along the bottom of the graph and shows the month names is called the X-axis. On many graphs, it will show some version of time. In this case, it shows the months in 2025.
The vertical line on the left side of the graph is called the Y-axis and, on this graph, it shows the amount of electricity used.
When you read the graph, you look along the X-axis at the bottom to find the month you are looking for and directly above that is a point (or a bar) that’s at a certain height above the axis.
Now you look left to the Y-axis to see the value for that point. So, in June of 2025, for example, I used just a bit less than 800 kilowatts.
Here’s the thing, though. You already knew how to read this graph. You just might not have known you were interacting with the X and Y axis when you read it. And, this is not the only place you interact with them. Every line and bar graph, no matter the context, has an X-axis and a Y-axis. They are how we make sense of a graph.
Since you read graphs like this and you interact with the X and Y axis when you do, you know what I’m going to say next…this makes you a math person.
X-Intercept & Y-Intercept
Now, let’s think about a different idea that’s also related to line graphs. When a point is directly on the X- or Y-axis, we call this point an intercept. The X-intercept is a point that falls directly on the X-axis (the horizontal line at the bottom of the graph) and the Y-intercept is a point that falls directly on the Y-axis (the vertical line on the left end of the graph).
To illustrate these, let’s think about a financial statement, like this one for an investment account.
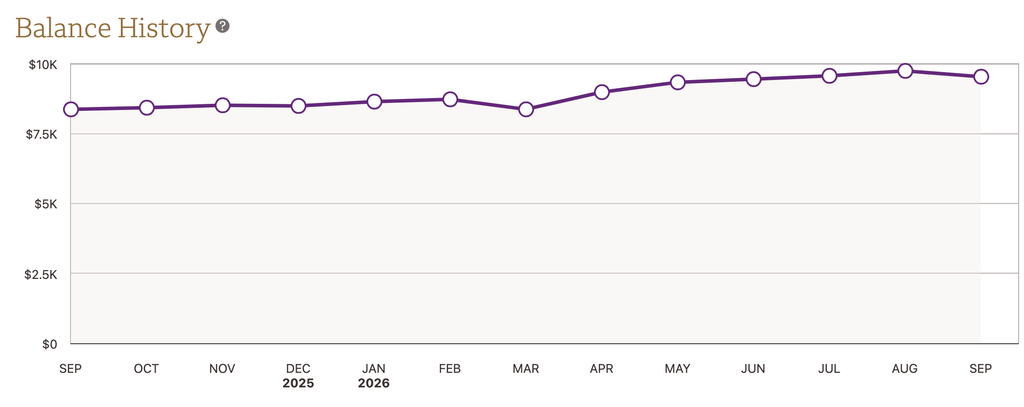
Here, we have time represented along the horizontal X-axis and money along the vertical Y-axis. These lines represent a starting point, or zero, so when a point is on the X-axis, your account has zero dollars in it. This graph does not have an X-intercept, so the balance has always remained above zero.
Since the Y-axis shows the value of the account in dollars, the point of the graph that is directly on this axis…the Y-intercept… shows the amount of money in this account at the beginning of the time period shown on the graph. In this example, in September of 2025, there was about $8000 in this account.
Again, you already know this information when you look at your statement. You just might not realize that what you are really interacting with are the X- and Y-intercepts. Even if you aren’t aware of these terms when you look at a graph, you are still interacting with them. So, the next time you find yourself reading a graph, take a moment to recognize you are interacting with these mathematical ideas and celebrate this makes you a math person.
Okay, so now that we have those related ideas out of the way, let’s talk about one that just begins with Y. This concept is one you’ve been interacting with since you were a child. You used to be very excited by it and now, as an adult, your excitement may have waned a bit. Have you guessed it yet?
Year
You know a year is the amount of time it takes for Earth to orbit the sun and you have been counting years since you were a small child. You might even celebrate each time you complete another trip around the sun. Even if you don’t, you are very aware of the passing years and you think about this idea often. Whether it’s your age, or how long it will take you to finish school, or how many you have left before retirement, the idea of year is on your mind more often than you realize, and that makes you a math person.
As we wind down this trip through the mathabet, remember I have turned this journey into a book! If you’d like to have the ideas I’ve talked about here…plus a few I didn’t mention…right at your fingertips for easy reference, I’d love for you to check it out. It’s available as an ebook and as a paperback and you can find it by going to onamission.bio/jennifermasonhardin. There, you will find a link to the books I’ve written and you can also “Meet me in your inbox” to sign up for updates about the podcast, the books, and more. I’m excited for you to read MATHABET and to have the opportunity to connect to you outside the podcast and website platform.
I’m so grateful you joined the conversation today! I’m on a mission to change the way the world sees math, starting with you. If you found value in this post, if something you read made you pause, or if you suddenly realized the hidden math in something you do every day, now is the time to join the movement!
When you comment here and share this site, or when you subscribe to, rate, and share the I See Math People podcast, the algorithms will show it to more people and the more people who get the message, the more mindsets can begin to shift.
Thank you for being part of this discussion of a few of the mathematical concepts beginning with the letter X and Y. I truly hope you heard something about the X- & Y- axis and intercepts and about years you can relate to and that it made you stop and think about where math shows up for you on a daily basis. Noticing where you interact with math is the first step to beginning your mindset shift and seeing yourself as the math person you really are.
I’m Jennifer Mason Hardin and everywhere I look I see math people just like you.